Recent Developments in Market Valuations
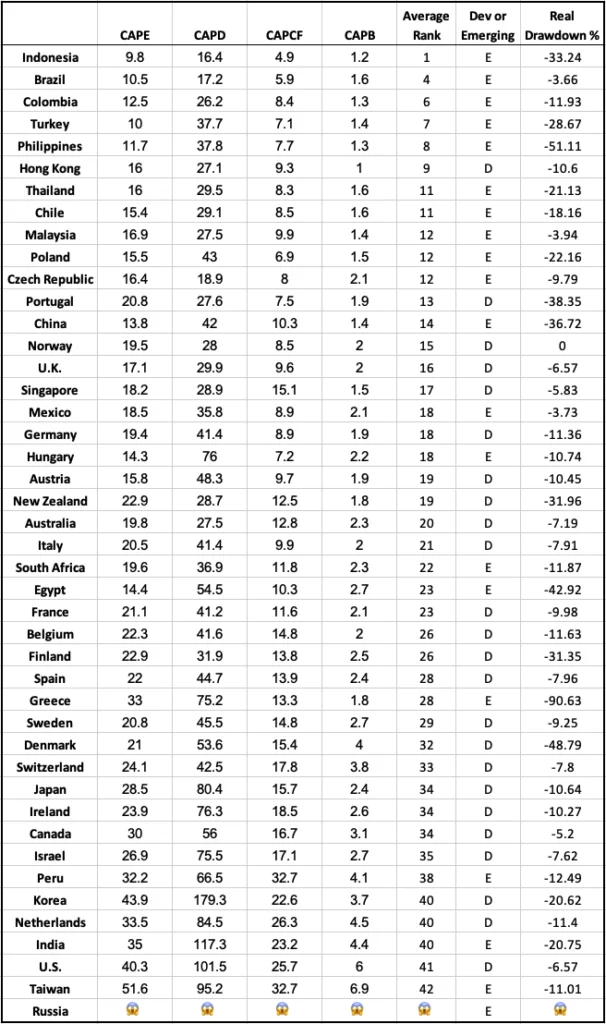
According to the latest figures from The Idea Farm, the global stock market valuations were updated as of June 30, 2026. This timing is crucial; market valuations can fluctuate significantly depending on economic cycles, geopolitical factors, and investor sentiment. Investors often look for signals in these metrics to guide their strategies. But what do these numbers really signify in the grander scheme of market dynamics?
Understanding the CAPE Ratio
Quarterly CAPE Ratio Overview
Median CAPE Ratio: 20
Lowest 25% (cheapest): 14
Highest 25% (most expensive): 33
The CAPE Ratio, or Cyclically Adjusted Price Earnings Ratio, is a tool frequently used by economists and investors to assess whether stock markets are undervalued or overvalued. By taking into account price and earnings over a decade, this metric aims to smooth out market fluctuations and give a clearer picture of long-term profitability. The median CAPE of 20 suggests that the market is generally at a balanced valuation, but there are notable extremes: the lowest quartile is at 14, indicating potential bargains, while the highest quartile at 33 suggests inflated valuations that could pose risks for investors.
Regional Variations and Their Implications
Foreign Developed Average: 24
Foreign Emerging Average: 19
Regional variations in CAPE Ratios can provide insights into different market dynamics. Developed markets averaging a CAPE of 24 signifies a relatively higher valuation reflecting stability and maturity, whereas emerging markets at 19 indicate they might offer growth potential at a lower valuation. This divergence is critical for portfolio diversification strategies, as it illuminates where investors might seek undervalued assets. If you're working in this space, you might consider balancing your investments accordingly, focusing on regions that provide better risk-adjusted returns.
Methodology and Market Representation
It's essential to highlight that the metrics provided are derived from the MSCI Investable Market Indices (IMI). This broader index typically encompasses a larger number of companies, making it a more accurate reflection of market conditions in comparison to MSCI's Standard Indices. For smaller market countries like Greece and Egypt, this distinction is crucial. Inadequate representation in smaller indices could lead to skewed data, affecting investment strategies and decisions. The IMI may give a broader view, making it easier for investors to account for market conditions across diverse economies.
Impact of Valuation Metrics
The use of a valuation composite allows for averaging across various financial metrics. This approach effectively neutralizes anomalies that may arise from individual indicators, particularly in markets exhibiting structural biases. Markets can be prone to irrational behaviors influenced by short-term events, such as earnings reports or macroeconomic indicators. A composite valuation can help investors focus on long-term trends rather than short-lived fluctuations. For investors, this comprehensive perspective can lead to more informed decisions, potentially reducing risks associated with market timing.
Additional Resources for Market Insights
For those interested in broader stock market insights, here are several reputable free resources for global valuations:
For those seeking more in-depth analyses, paid options like Finaeon and Ned Davis Research are recommended. Suggestions for additional sources are welcome!
Future Outlook and Considerations
What this means for you as an investor is profound. As markets begin to experience new economic realities, understanding these metrics will become increasingly important. The CAPE Ratio can act as a leading indicator for trends; markets with higher ratios may face correction if earnings fail to keep up, while those with lower ratios might offer hidden value during market downturns. Identifying these patterns early can lead to better positioning amidst volatility.
By staying informed and utilizing these resources, investors can navigate trends more effectively, adapting their strategies to the underlying economic conditions. If recent trends hold, the market could either face tightening or provide opportunities, depending on how effectively companies manage profits in the coming quarter.
Discussion
Sign in to join the discussion.